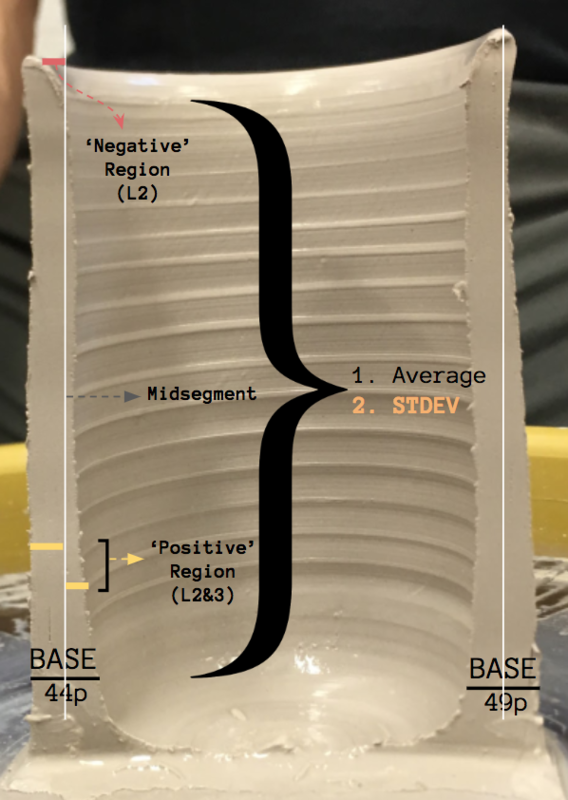
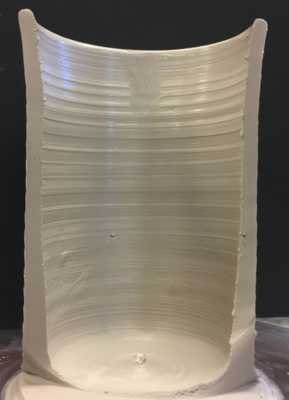
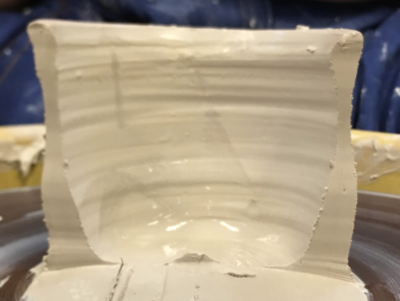
In order to determine whether or not our MaRS algorithm was more effective in teaching students to throw pots, we had to perform image analysis on the pictures of pots thrown by a teacher, a student after instruction with a teacher, and a student wearing the actuators. We decided that a good metric of analyzing the pots thrown by the individuals was to analyze how straight each of the pots were. To do that we split each pot in half to get a profile view of the edges of the pot. We determined where the base lay and drew a vertical line up from the midpoint of the base. We then, using ImageJ, measured the the distances, in pixels, of various lines to calculate the standard deviation of the lines in relation to the center line. Each side of the pot was split up into different component lines (as shown in the annotated image below) to determine the straightness of the pot. The hypothesis was that if the pot was completely straight then the distance between either edge of the pot from the center line should be the same, measured by standard deviation. Each component line had no more than 100 data points extrapolated from it. Smaller lines had fewer distances measured becuase there was less area to measure. All of our data can be found here.

As stated on our previous page about gathering and outputting data, we were unable to successfully output the pressures and make the actuator inflate consistently and in time to aid the student in throwing a put. Therefore, we, unfortunately, were unable to test the validity of this method of teaching students how to throw a pot. However, the actuators did hold up while they worked, proving that the King Actuator can be used in vigorous applications.


