Run job and view results
Run job

[Video: Create, submit and monitor job]
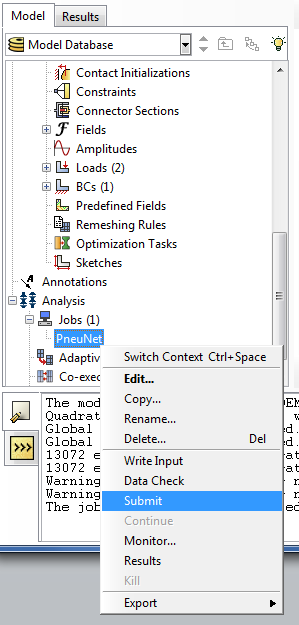
Now, we are ready to submit the job and run the simulation. In the model tree, under Analysis, double-click on Jobs to create a new job. You can use the default settings, or change certain options (i.e. multiple processors) so that Abaqus can use more computer resources and complete the job faster.
Right click on the newly created job and select Submit.
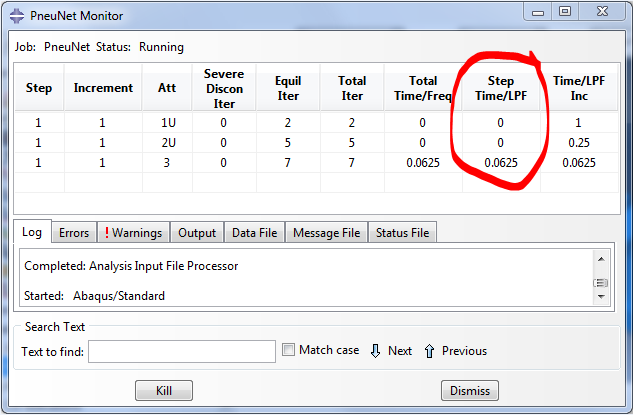
You can monitor the progress of the simulation by right clicking on the job and selecting Monitor. A new window will pop up. In the Step Time/LPF column you can see the percentage completion of that step.
View results
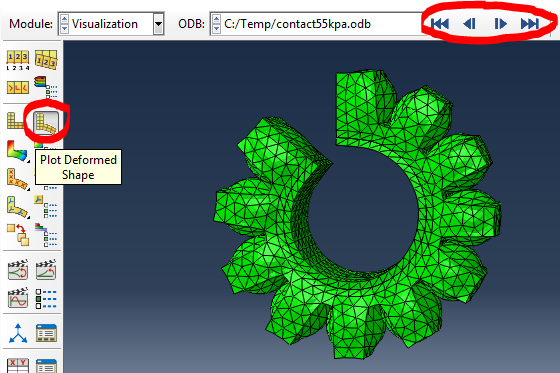
Once the simulation finishes, you can observe and analyze the results by right clicking on the job you just ran, and selecting Results. If you need to keep your results, they are saved in a large .odb file, typically in the TEMP folder or in the same directory as your model (.cae) file.

There are a several things you can do when viewing results. For example, clicking Common Options lets you tweak the appearance of the model result (i.e. shading, wireframe view, etc.)
To see what the actuator looks like after gravity and pressure have been applied, click on Plot Deformed Shape. The navigation arrows in the top right corner of the screen allow you to scroll through the step increments and see how the actuator reaches its final shape.
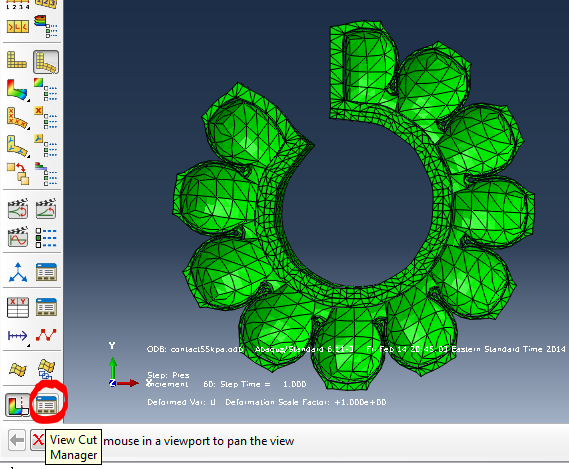
You can use the View Cut Manager to see section views of the deformed actuator, and use the button next to it to easily toggle the view cut on and off.
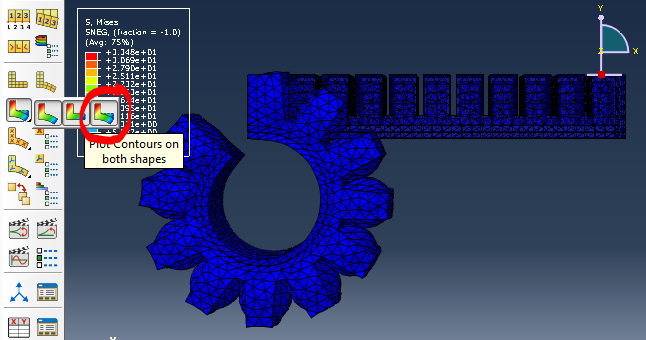
You can Plot Contours on both shapes (click and hold the toolbar button to make this option available), which superimposes the initial and final actuator shapes. This also lets you see the actuator color-coded by stress (Mises). Note that the actuator looks entirely blue (low end of the scale); this is because the highest stresses are in the paper layer, which is not visible, which affects the relative scale that Abaqus uses to color-code the model.
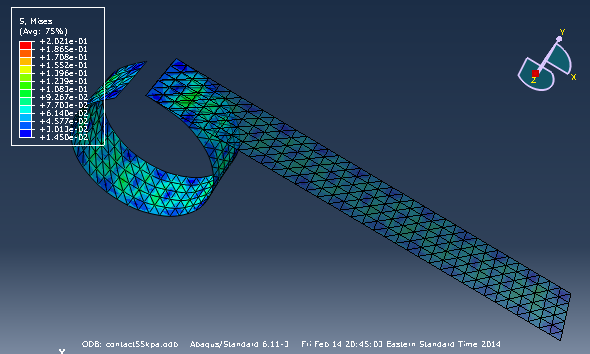
We can verify this by using the Display Group Manager again to isolate the paper layer, and now we can see the color-coded stress.
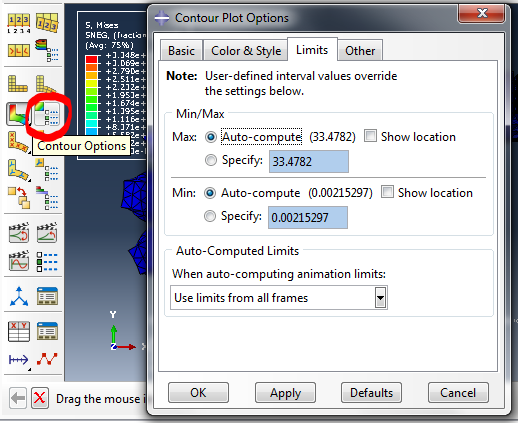
To see color-coded stress in different areas of the elastomer body of the actuator, we can manually change the scale using Contour Options. Note that by default, the scale limits are auto-computed by the minimum and maximum values in the model results.
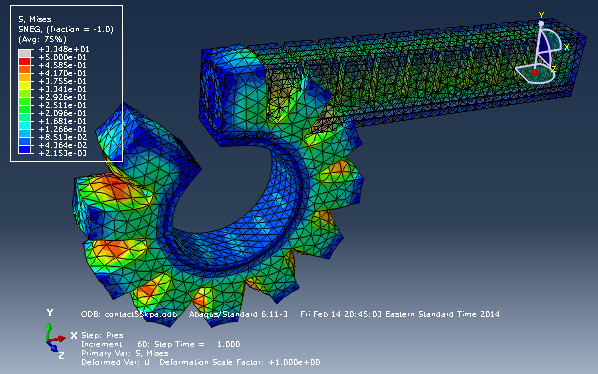
Try specifying the maximum value as 0.5 and note that now you can see the stress color-coding in the actuator.
Bibliography
Ilievski et al. (2011) Soft robotics for chemists.
Mosadegh et al. (2013) Pneumatic Networks for Soft Robotics that Actuate Rapidly.
Ogura et al. (2009) Micro pneumatic curling actuator: Nematode actuator.
Polygerinos et al. (2013) Towards a soft pneumatic glove for hand rehabilitation.
Shepherd et al. (2011) Multigait soft robot.
Sun et al. (2013) Characterization of silicone rubber based soft pneumatic actuators.
Contributors
Panagiotis Polygerinos
Bobak Mosadegh
Alexandre Campo